.png?width=200&height=92&name=Tribal%20Logo%20Dark%20Grey%20(1).png)
Employee advocacy programmes rarely fail loudly. They plateau, quietly, somewhere between month 12 and month 18 and the explanation offered is nearly always the same: the content needs refreshing, the tool needs replacing, the training needs rerunning.
Our new, never before published, research suggests the explanation lives somewhere else entirely.
The Human Edge draws on 40 months of continuous measurement across 860 global B2B companies: 27,000 data points tracking what people did on LinkedIn every month from March 2023 to June 2026, measured separately for CXO leaders, VP and Director-level leaders, sales professionals and employees overall.
Where most research in this space surveys programme managers about what their organisations do, this study measured behaviour directly, layer by layer, over time, and it points to one conclusion.
Influence rises and falls as a connected system, not as a collection of separate programmes.
The influence cascade runs both up and down
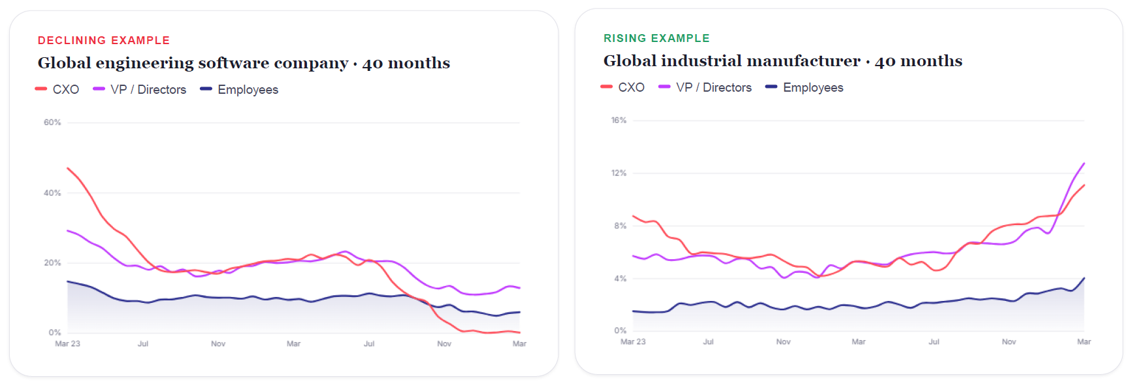
When leaders post more, employees follow. When leaders go quiet, employees go quiet too, usually within two months. That link held in 82% of the companies we tracked, across all 11 industries, positive in 98% of companies even in the weakest sector.
The uncomfortable half of the finding: the same mechanism works in reverse. In 34% of companies, leaders, managers and employees all lost ground together across the study period. One in three organisations, quietly declining at every layer, with no single decision causing it.
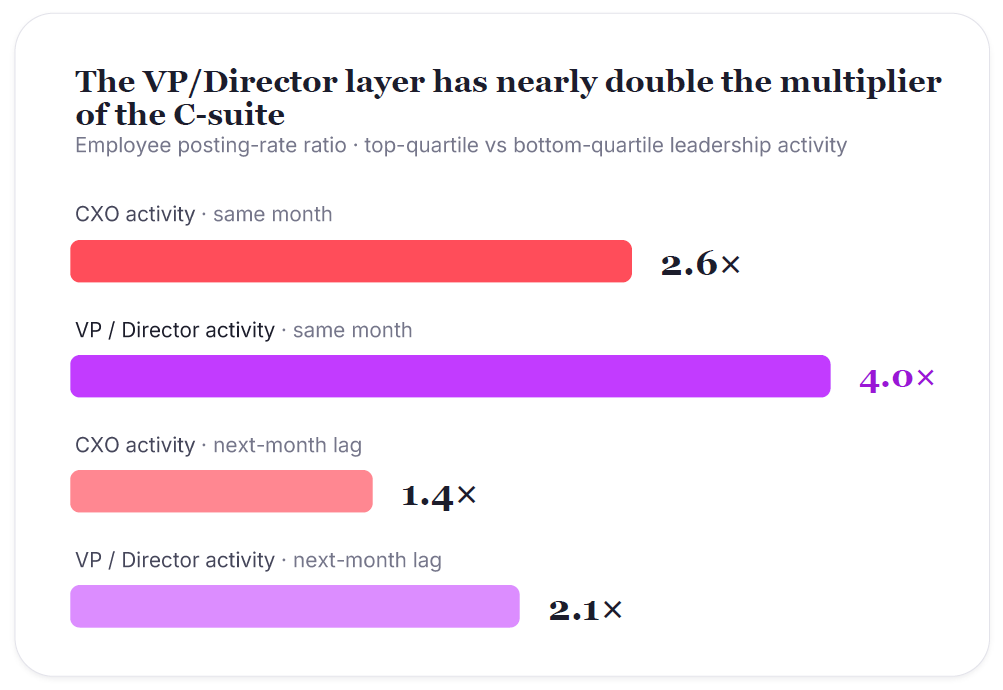
The multiplier sits below the C-suite
The most counterintuitive finding in the dataset concerns where the influence really sits. Companies with the most active VP and Director layer see 4x the employee posting of those with the least active. The equivalent figure for the C-suite is 2.6x.
The management tier directly above sales teams, experts and employees is where trust norms get set. It is also, in our experience, the layer most programmes skip: enablement investment goes to executive ghost-writing at the top and employee training at the bottom, while the layer with nearly double the multiplier goes unaddressed.
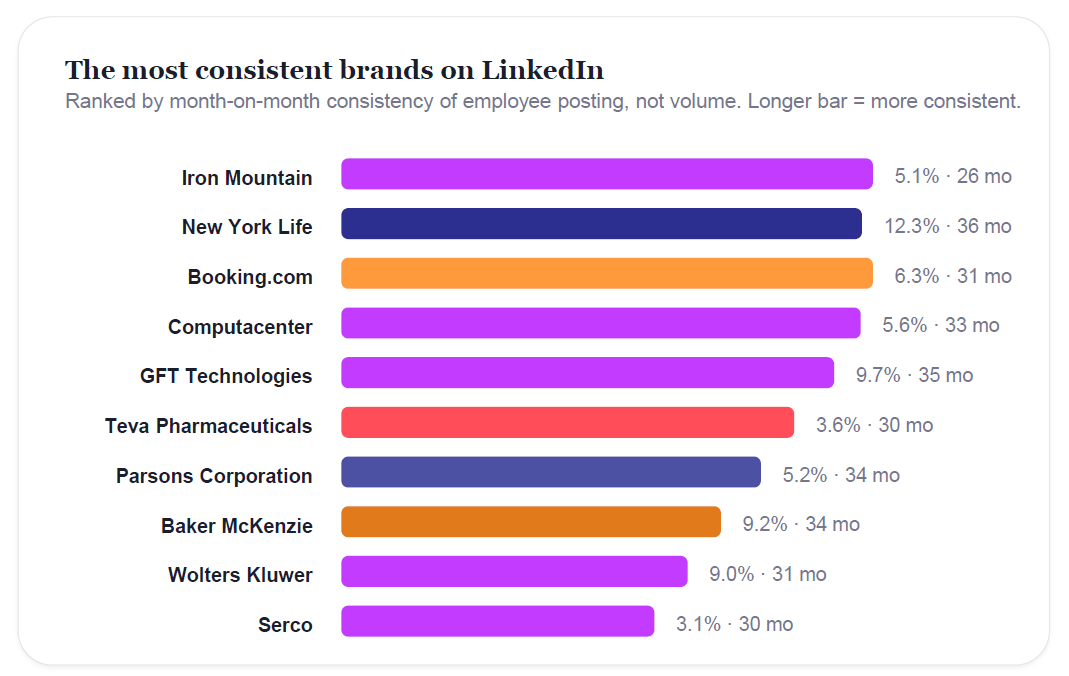
Consistency beats volume
The most consistent companies in the dataset post 25% more than the least consistent, with three times less month-to-month variation, and the top of the consistency table is instructive: Iron Mountain, New York Life, Baker McKenzie, Teva Pharmaceuticals, Parsons Corporation. None of the top five are technology companies. In 8 of the 10 most consistent organisations, consistency holds at every layer, top to bottom.
That pattern is culture, not campaigning. A programme that peaks around launches and fades in between has a habit problem, and habit problems do not respond to content.
The warning signal most dashboards miss
In 80% of companies, this month's VP and Director activity predicts next month's employee activity, moving one to two months ahead of any visible change lower down. Employee influence has a leading indicator. Most measurement frameworks track only the lagging end, which means declines get discovered months after they began, usually during a budget conversation.
What this means for the way employee advocacy and influence is built
Most organisations run people-led influence as five separate efforts: advocacy in marketing, digital selling in sales enablement, executive visibility in communications, employer brand in HR, thought leadership wherever it last landed. Each is defensible alone. The data shows what the structure costs: the primary driver of whether trust builds in a market is the collective behaviour of an organisation's people, more than any individual programme, and behaviour left in silos pulls in different directions.
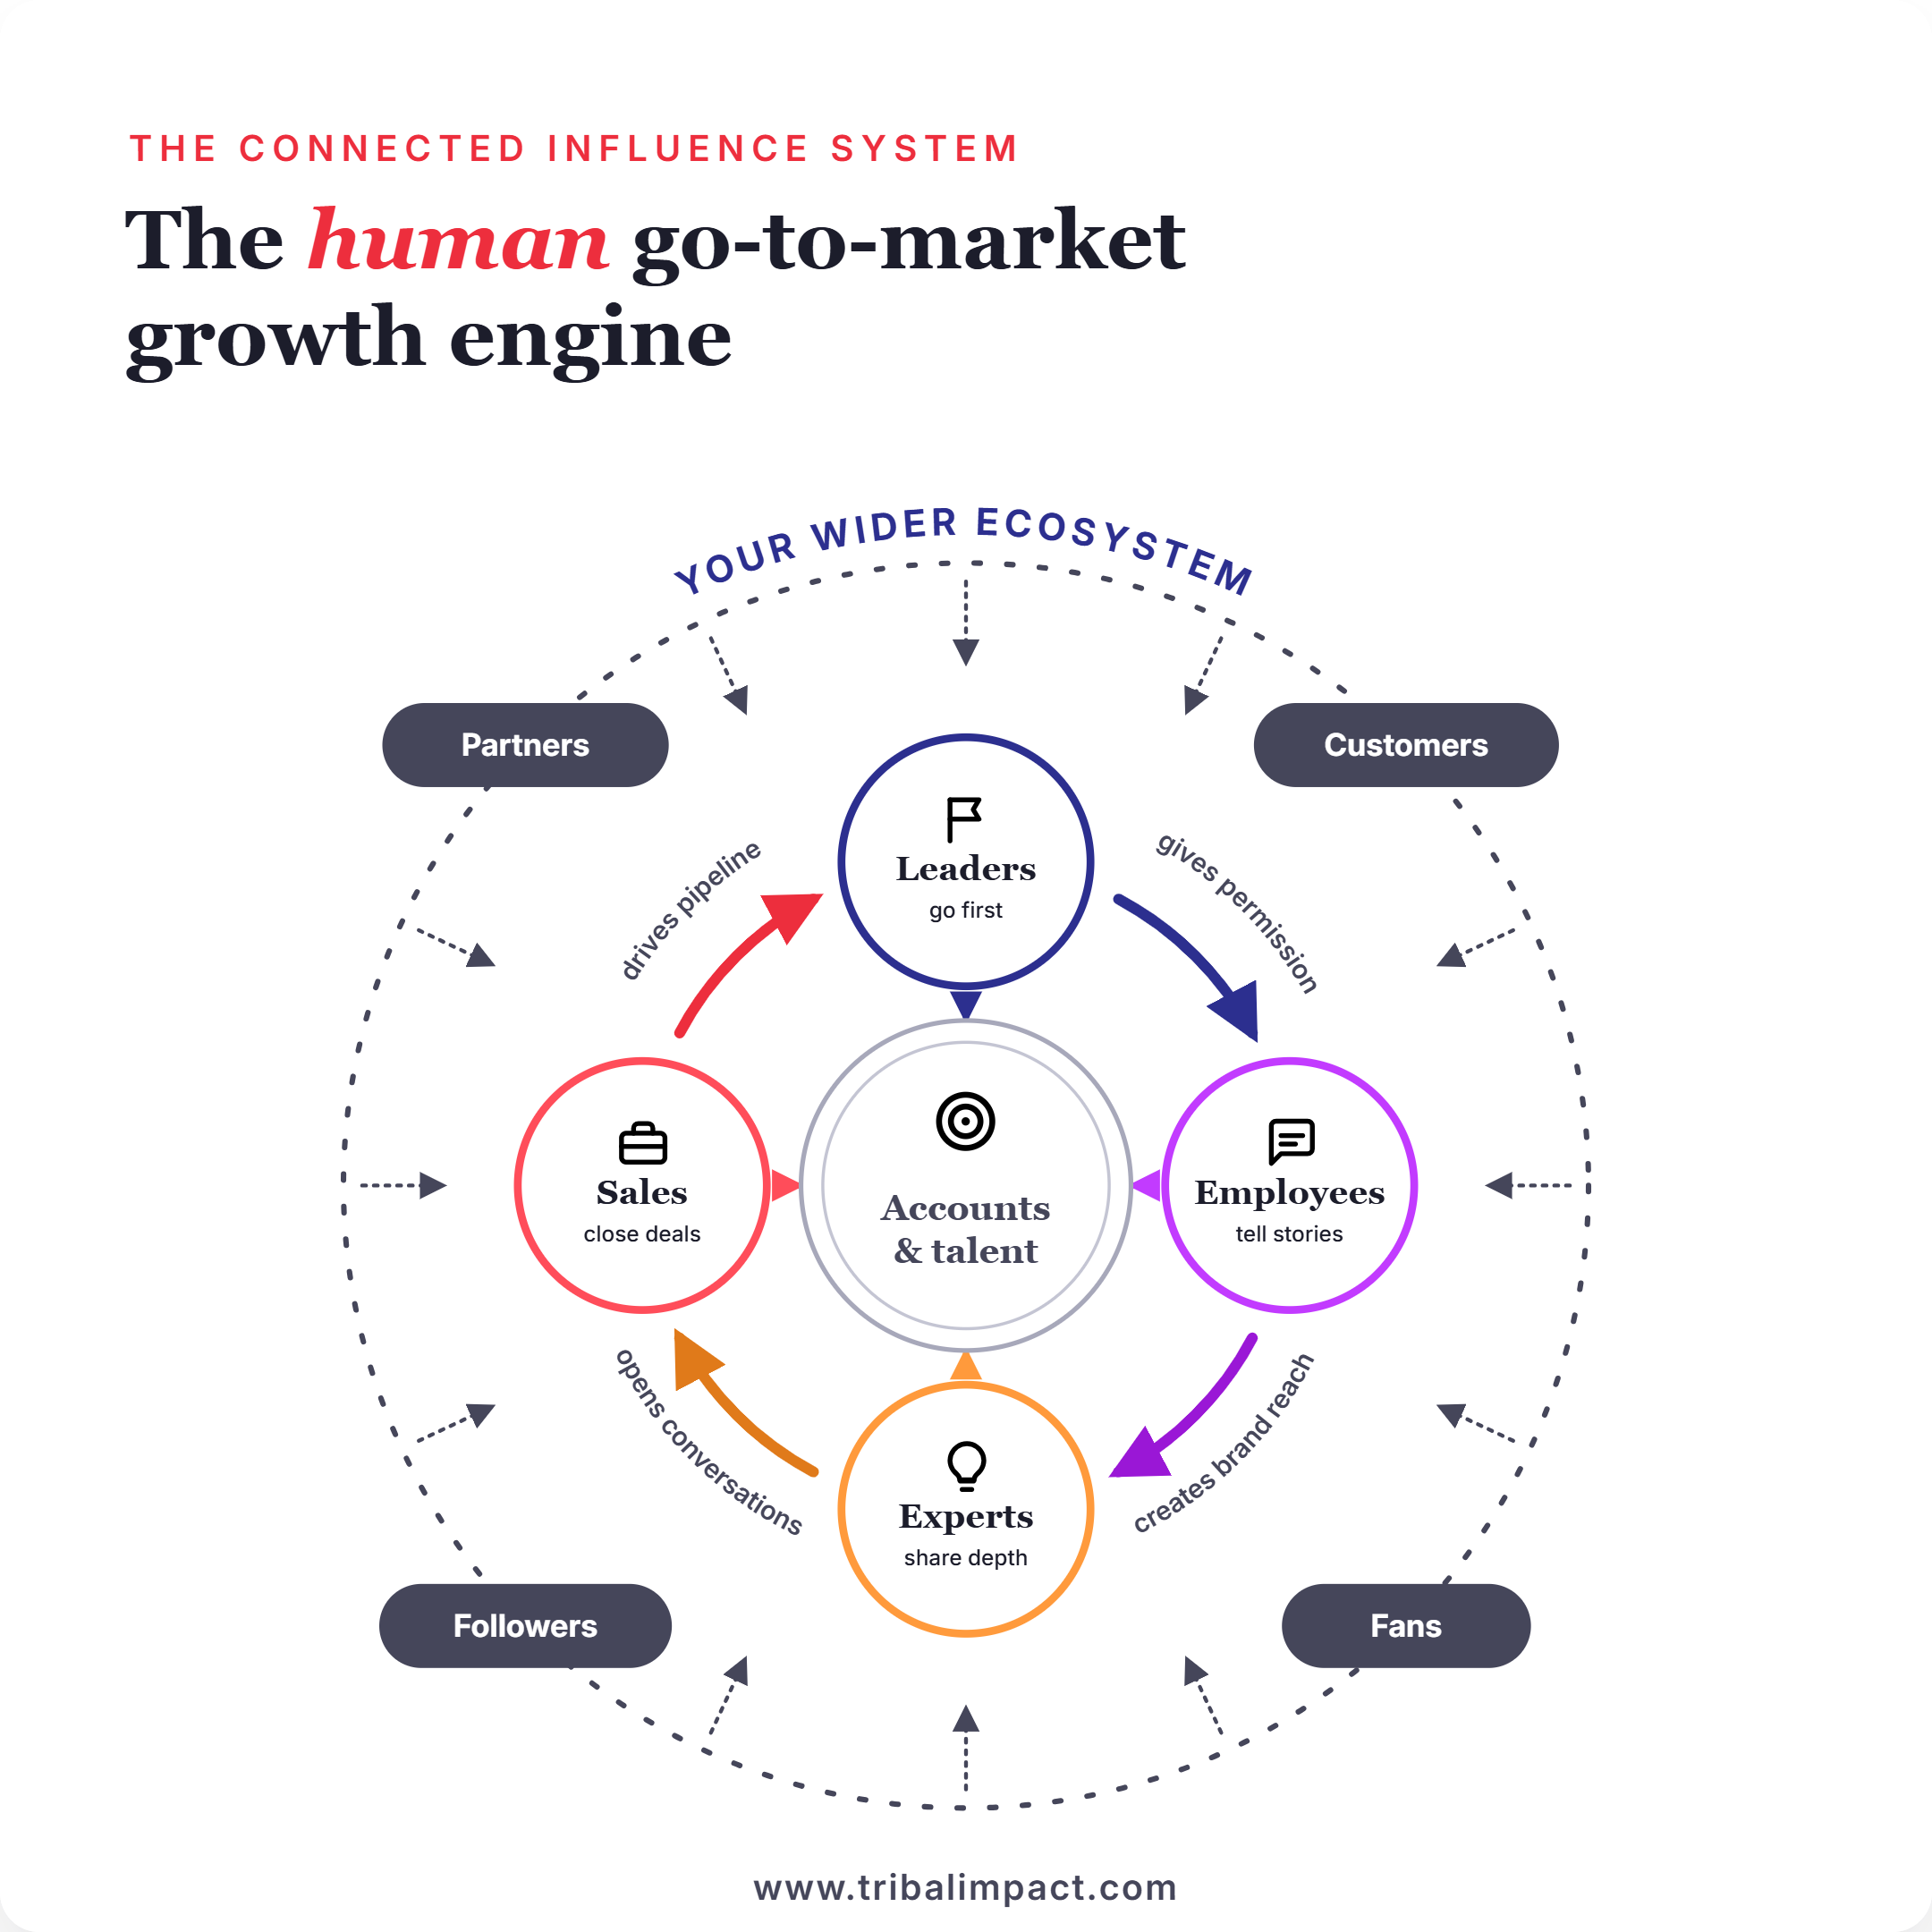
Connected, it compounds, and it can be aimed.
-
Leaders signal permission.
-
Managers set the norm.
-
Experts earn citations in the places buyers research.
-
Sellers arrive at deals already known.
Pointed at target accounts, the system becomes a human go-to-market growth engine with a measurable relationship to commercial outcomes.
The report includes what good looks like: benchmark leader boards for the most active employee bases and CXO layers, the most consistent brands over three years, and sector-level analysis across all 11 industries, because the honest benchmark for a legal firm is other legal firms, and the honest benchmark for a software company is the 197 technology firms in the panel.
Where to start
Three questions determine whether the findings become useful. Where does your activity sit against your sector, by layer? Is your VP and Director layer rising or falling, since it moves first? Are your programmes connected to each other and to named commercial goals, or running in parallel?
The full report is available now, findings ungated. For organisations that want the precise answer to the first question, we benchmark leadership, sales and employee activity against the full 860-company dataset, by industry, seniority and function, and show where the gaps are and what closing them is worth.
Read The Human Edge: https://www.tribalimpact.com/thehumanedgereport
The sector report series begins in September with IT and Technology.