82%
Leadership behaviour is contagious
When leaders post more, employees follow. When leaders go quiet, employees usually do too, within two months.
.png?width=200&height=92&name=Tribal%20Logo%20Dark%20Grey%20(1).png)
What B2B CMOs are missing about influence, trust and commercial growth.
Not who has the best product, the strongest case study, or the most competitive price. Who they trust. That decision was formed months earlier, through the visible, credible presence of the people they encountered in conversations both online and offline. Your brand channels almost certainly were not part of that process.
Research from Google and Bain found that 86% of B2B buyers arrive at the start of a buying process with a shortlist of three to five vendors already in mind, and 92% of purchases are ultimately made from that list. The influence that decides who gets onto that shortlist happens much earlier, in the conversations, content and connections that reach a buyer before they signal intent. That is where trust is built or lost, and where many organisations are entirely absent.
The urgency has sharpened. AI has flooded every channel with fast, cheap and interchangeable content, and the tools buyers use to research vendors no longer surface brand campaigns. Forrester’s 2026 Buyers’ Journey Survey ranks generative AI and conversational search above vendor websites and sales reps, favouring earned media and expert voices over anything a brand publishes about itself.
After a decade of working with executives, sales teams, mid-level managers and subject-matter experts across global organisations, we kept seeing the same pattern:
The answer is unambiguous: the pattern is more structured, more consistent and more commercially significant than most organisations recognise.
Want to download the PDF version of this report?
|
40 months of continuous measurement. 27,000 data points. One consistent pattern in how trust moves through an organisation.
When leaders post more, employees follow. When leaders go quiet, employees usually do too, within two months.
Companies with the most active VP and Director layer see four times the employee posting of those with the least active management layer.
In 34% of companies, leaders, managers and employees all lost ground together. The same mechanism that lifts activity pulls it down.
Even in the weakest sector, the leadership-to-employee link is positive in 98% of companies tracked.
The most consistent companies post 25% more than the least consistent, with three times less month-to-month variation.
In 80% of companies, this month’s VP and Director activity predicts next month’s employee activity.
CXO activity was at its highest when tracking began in early 2023, when on average 25% of CXO roles were posting on LinkedIn. It has since fallen to between 13 and 15%. VP and Director activity followed the same path, and employee activity dipped from around 10% to 6 or 7%.
The early-2023 high coincided with the tail of the pandemic, when leaders were unusually visible online for a still-remote workforce. As working life normalised, that activity fell away.
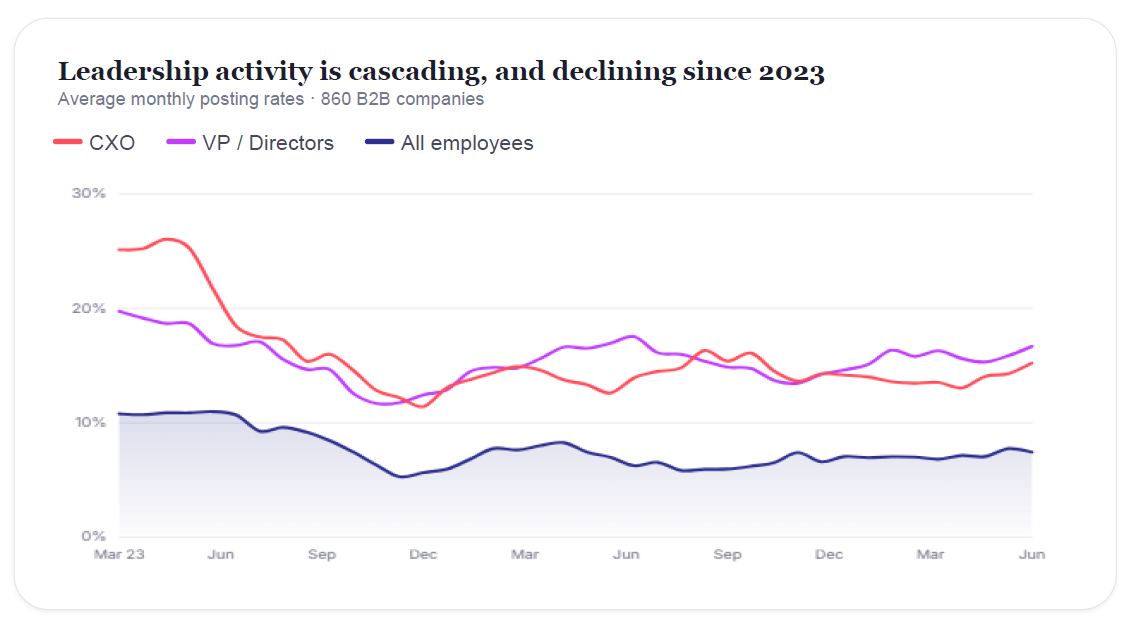
Fig 1. All three groups peaked in 2023 and have plateaued since. The lines move together.
Want to benchmark your organisation against our data-set?Better understand how a connected system of influence could impact your sales pipeline, |
of the companies tracked have seen CXO activity on LinkedIn fall since 2023. Yet among the most consistent companies,
employee activity held regardless.
When leaders show up consistently, managers follow. When they go quiet, so do managers. Leaders do not need to become content creators, but they do need to show up regularly, with a genuine point of view.
The most counterintuitive finding in the dataset is that the layer with the greatest influence on employee behaviour is not the C-suite. It is the VP and Director layer, the management tier directly above sales teams, experts and employees.
Across all industries, companies with the most active VP and Director layer see four times the employee posting of those with the least active management layer. That is where trust norms are set, and where enablement investment delivers the highest return.
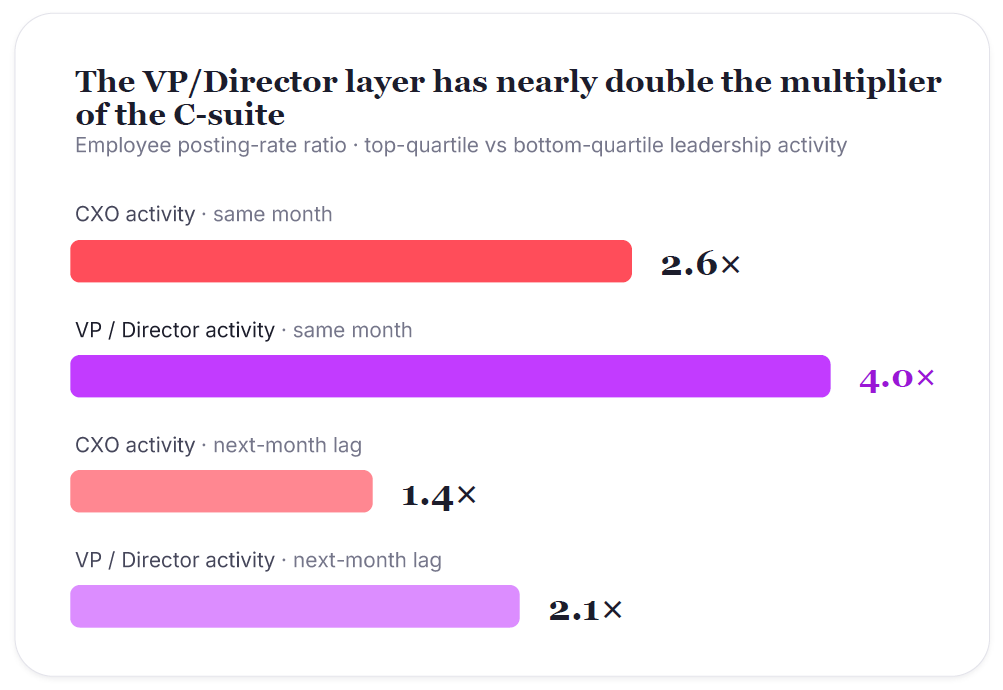 Fig 2. Employee activity in companies with top-quartile vs bottom-quartile leadership activity.
The most counterintuitive finding in the dataset is that the layer with the greatest influence on employee behaviour is not the C-suite. It is the VP and Director layer, the management tier directly above sales teams, experts and employees.
Across all industries, companies with the most active VP and Director layer see four times the employee posting of those with the least active management layer. That is where trust norms are set, and where enablement investment delivers the highest return.
Want to download the PDF version of this report?
|
Companies typically rush to activate the C-suite. A visible presence at the top matters, but it is the layer in between that influences employee behaviour most. This is the gap that most often goes unaddressed.
The most sobering finding is not about growth, it is about what happens in reverse. The same mechanism that pulls employee activity up also drives it down. When CXO activity falls, VP and Director activity follows; when that falls, employee activity follows. Across the 860 organisations, 34% showed all three groups declining together.
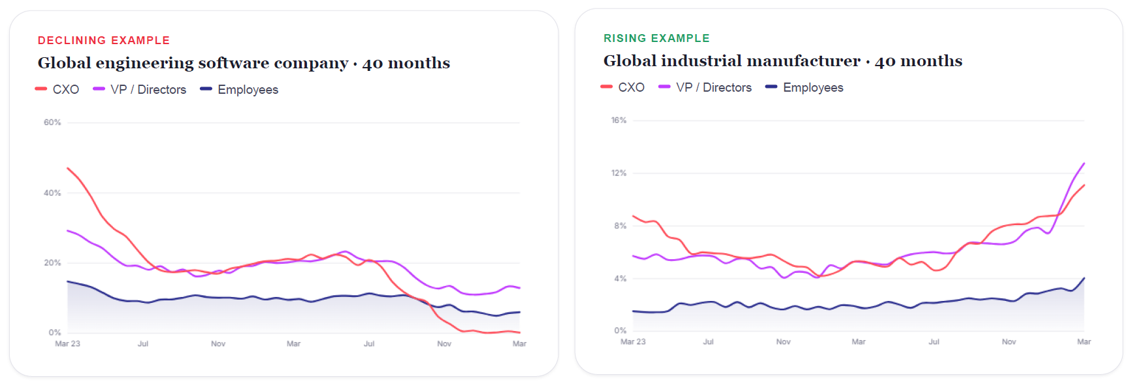 Declining example · Global engineering software company · 40 months. Rising example · Global industrial manufacturer · 40 months
In the declining case, CXO activity fell from 47% of leaders posting monthly to near zero over 18 months, and employees followed. The rising case is the opposite: a slow, consistent build that compounds into genuine market presence and a competitive advantage that is hard to replicate.
VP and Director activity this month predicts employee activity next month in 80% of companies, and drops one to two months before employee activity does, long before it shows in pipeline.
This is not a technology-sector story. The cascade appears in Financial Services, Consumer Goods, Life Sciences, Legal, Engineering and Energy. What varies is the strength of the effect, and that is useful: it tells you what benchmark to hold yourself to in your sector.
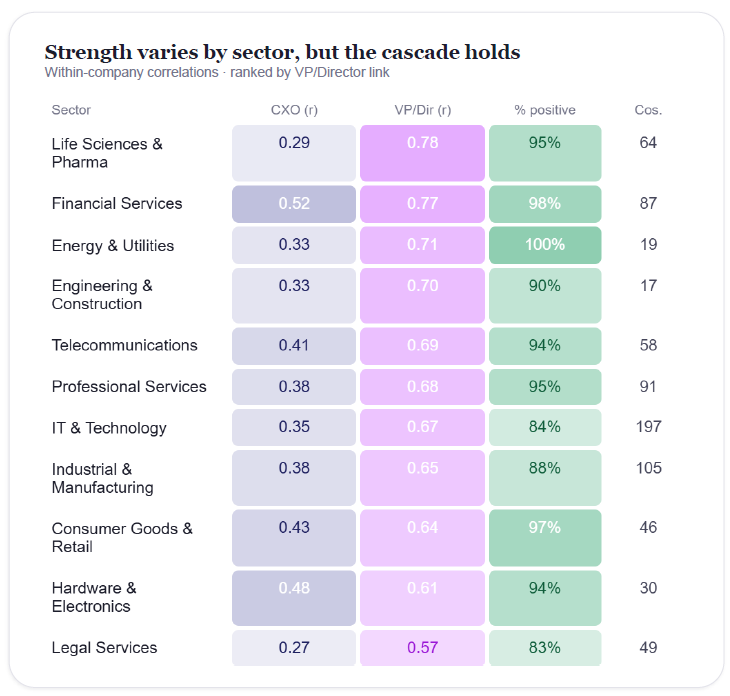
Fig 5. VP/Director correlation is stronger than CXO correlation in every sector. Companies over 1000+ employees shown here.
11.3% of lawyers post monthly, the most active sector tracked, yet Legal has the weakest leadership-to-employee link. High activity does not always mean a connected culture.
Legal shows how individual experts build personal brands. IT and Technology show how executives stay consistent. The organisations that build faster benchmark against everyone, not just their own sector.
Legal shows how individual experts build personal brands. IT and Technology show how executives stay consistent. The organisations that build faster benchmark against everyone, not just their own sector.
Drawn from the full 860-company dataset, filtered to companies with 1,000+ employees and at least 12 months of data. Deliberately cross-industry.
Consistency, not volume, is the signal of a trust-building culture
Iron Mountain, New York Life, Baker McKenzie, Teva Pharmaceuticals and Parsons Corporation: none of them technology companies, all posting consistently every month for two to three years. Consistency is the hardest thing to replicate quickly, which is what makes it a durable advantage.
In 8 of the 10 most consistent organisations, the VP and Director layer is also more consistent than the dataset average.
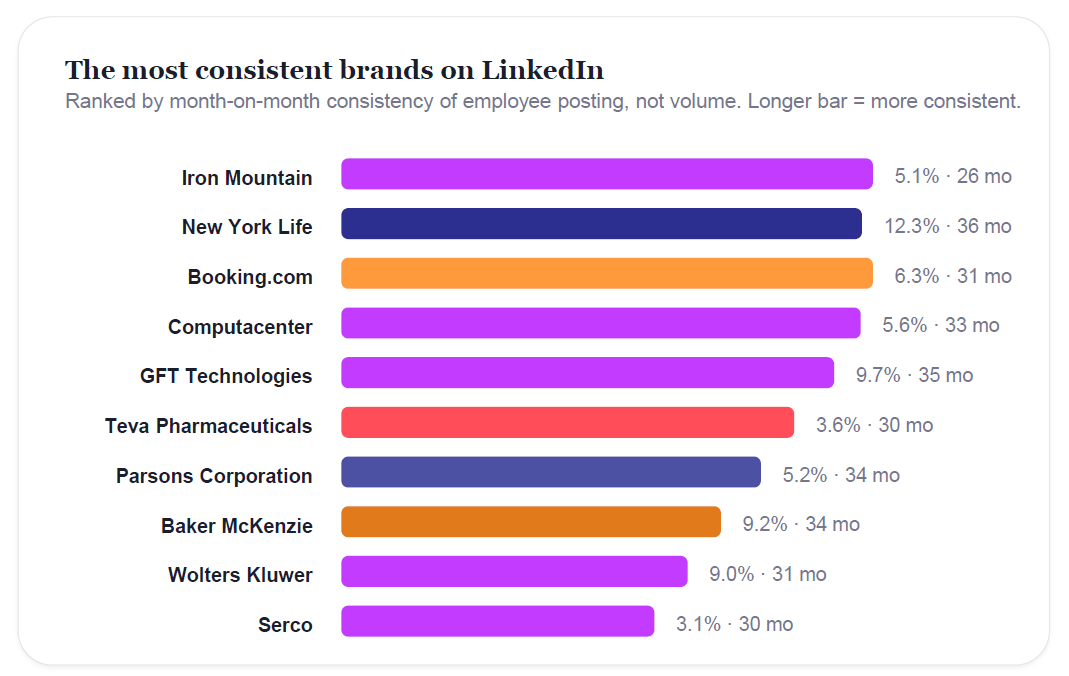 Fig 6. Most consistent brands by employee posting rate. None of the top five are technology companies.
of the most consistent companies are consistent at every layer, top to bottom. This is culture, not a campaign.
% of all employees posting in an average month · top 10
% of CXO-level leaders posting in an average month · top 10
Most B2B organisations run people-led influence as separate, isolated programmes. The data makes the limitation plain: collective behaviour matters more than any individual programme.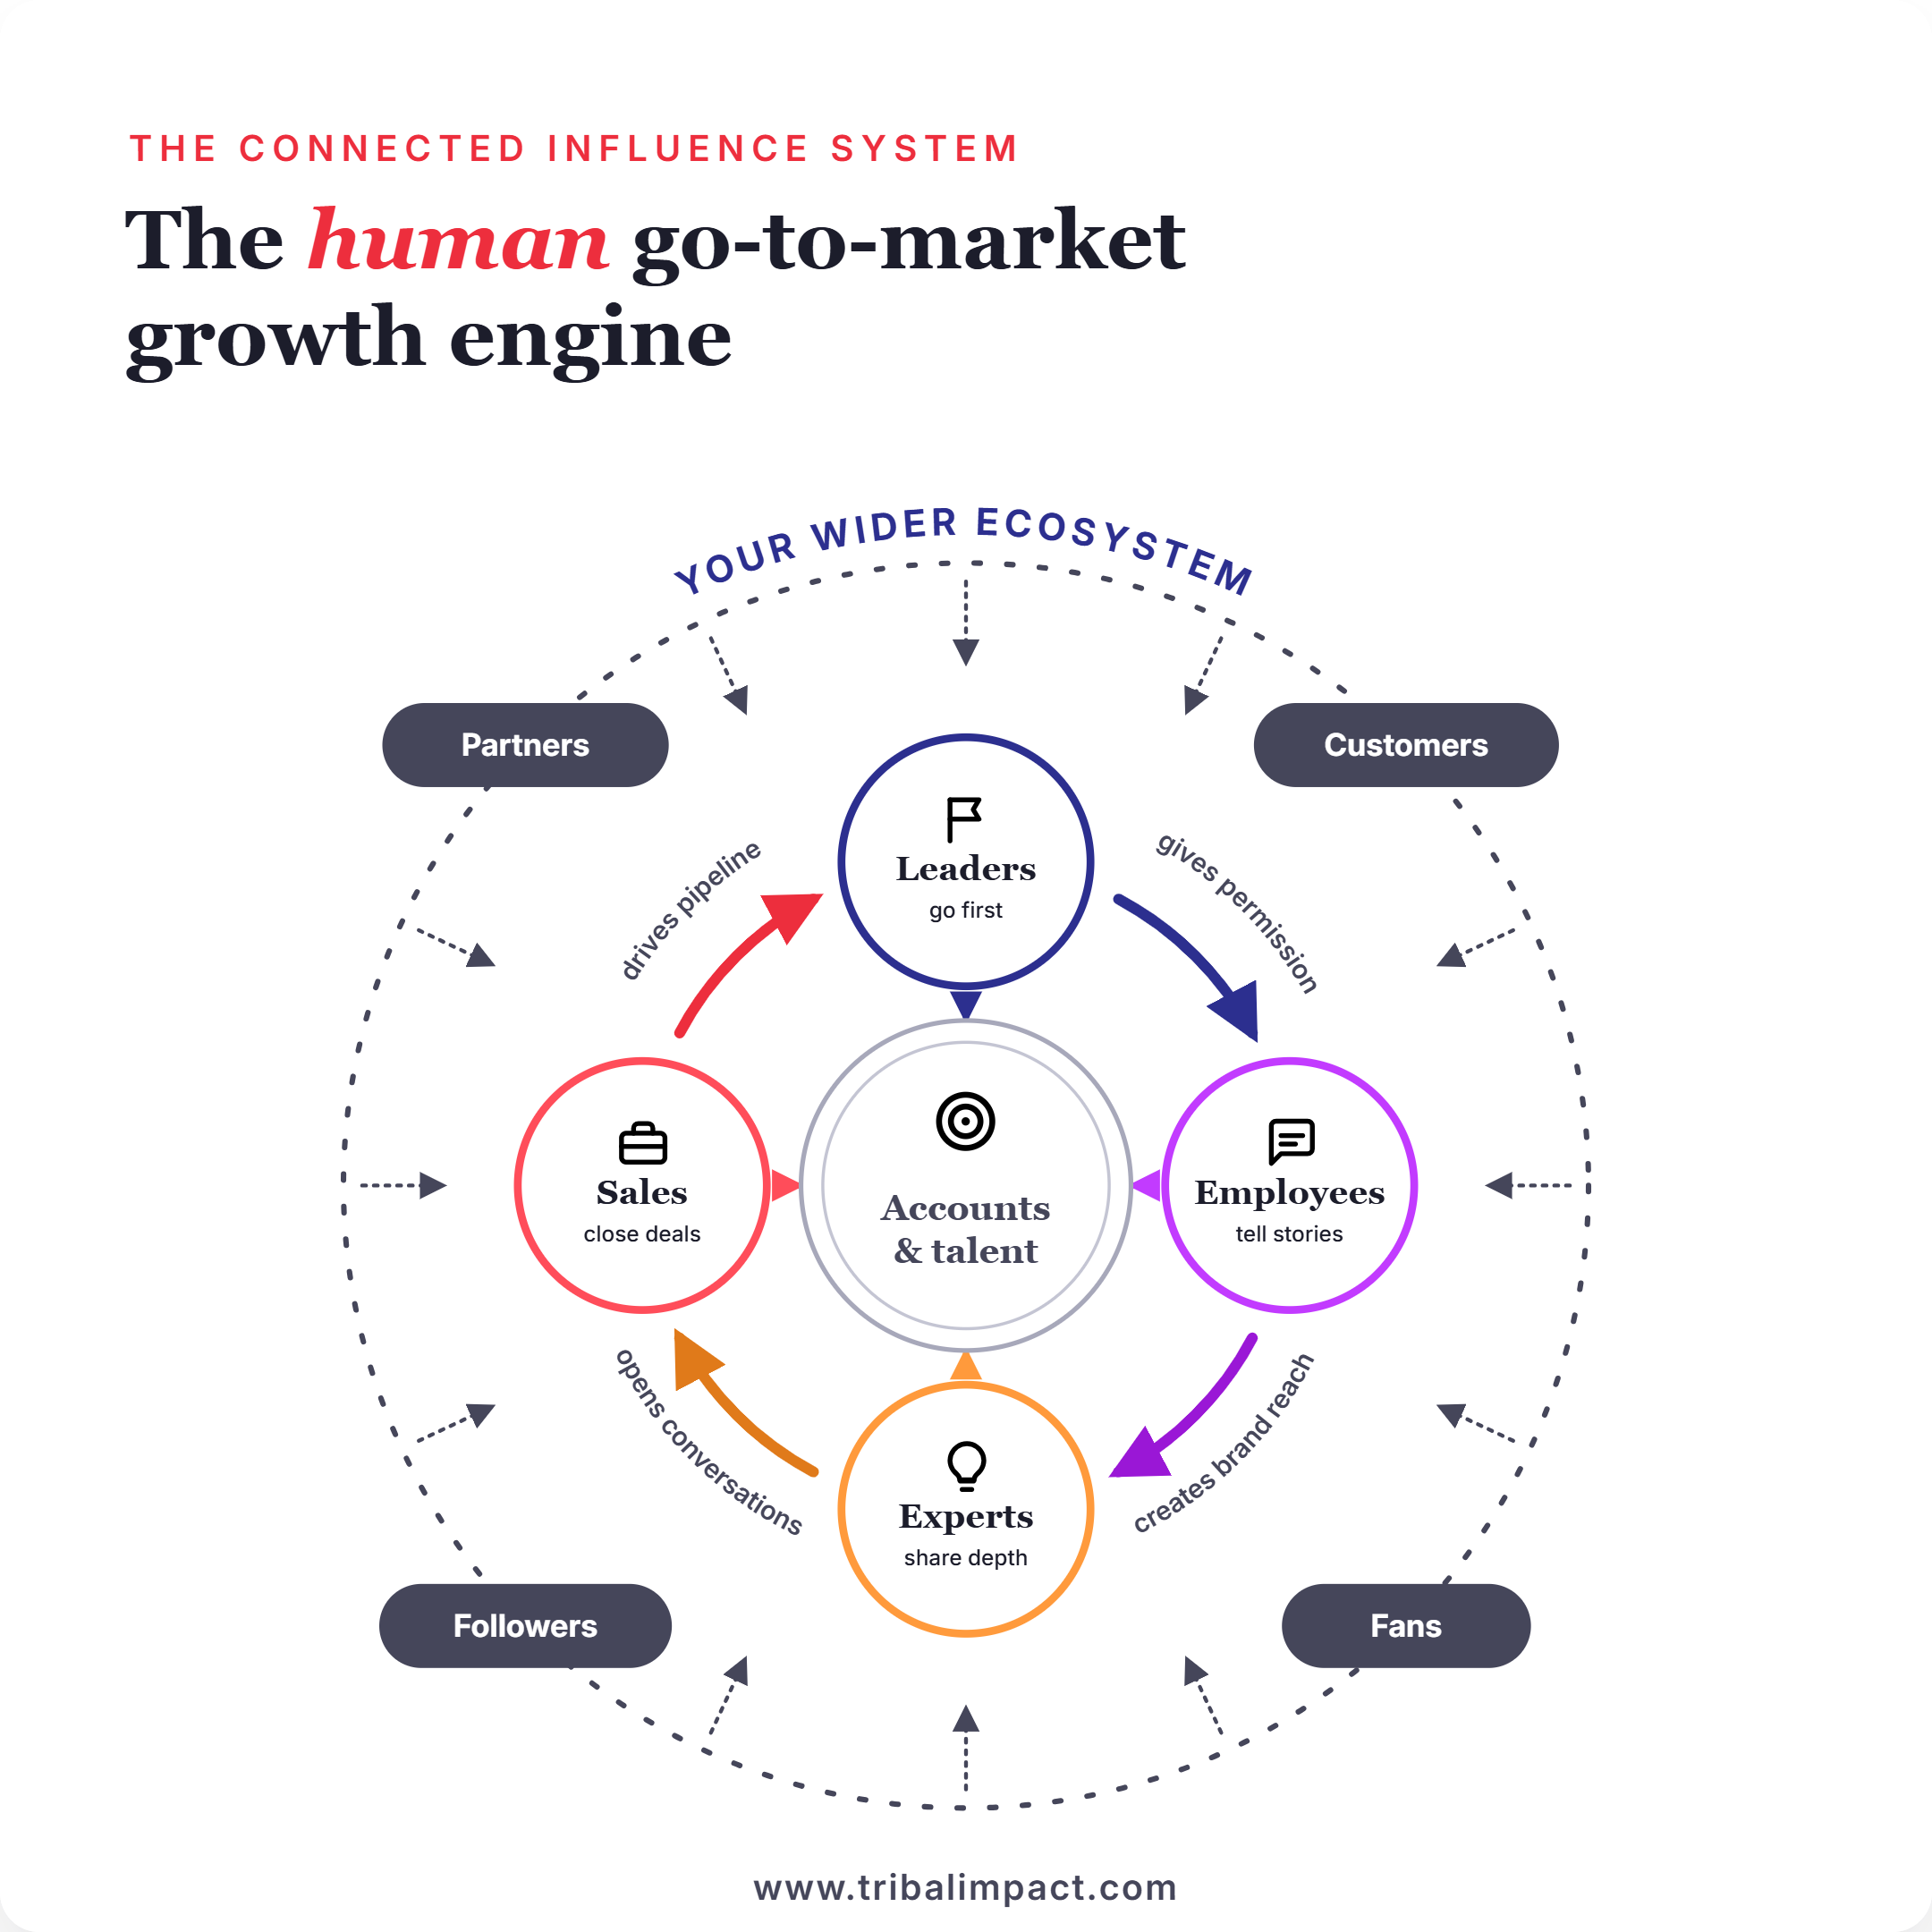
Want to download the PDF version of this report?
|
When these four groups are connected, they create a compound trust effect no single isolated programme can replicate. Depth matters more than reach: concentrate a small group of credible voices on the audiences that matter, then widen from a position of strength.
Builds visible authority and trust for your most senior people.
Turns everyday employees into an organic reach and referral engine.
Establishes subject-matter experts as credible, cited voices.
Equips sellers to build presence and open warmer conversations.
Activates employees to strengthen employer brand and hiring.
The primary driver of whether trust is building in your markets is the collective behaviour of your people, more than any individual programme. Left in separate programmes, that behaviour pulls in different directions and much of it is lost.
Connected, it compounds. Trust is already flowing through your organisation. The question is whether it is flowing towards the audiences you are trying to win. The answer is a shift in how you think about the programmes you already run: not five separate efforts, but one connected system.
The organisations winning the commercial trust advtantage have understood what cannot be automated: real people, with genuine expertise and consistent presence who build the kind of trust that puts you on the buyer’s shortlist before the formal process begins.
Trust does not compound in silos. It compounds in systems, where the behaviour of leaders, managers, experts and employees reinforce each other, month after month, in the direction of the audiences they are trying to reach.
The B2B trust consultancy that turns the influence of your people into measurable commercial growth. With over a decade of expertise, proprietary frameworks and data, we activate the voices, opinions and influence of your people, and connect it to what matters: deal velocity, pipeline growth, revenue resilience, talent attraction and retention, and competitive differentiation.
This report draws on 40 months of continuous monthly measurement of LinkedIn posting behaviour, from March 2023 to June 2026. For each company, every monthly snapshot recorded the percentage of people who posted content in the previous 30 days, calculated separately for all employees, CXO-level leaders, VP and Director-level leaders, and Business Development and Sales professionals.
860 companies were included, each appearing in at least two calendar years. After cleaning anomalous rows, the dataset held around 27,000 valid company-month observations. Relationships between groups are reported as Pearson correlations, taken as the median of individual company values rather than a single pooled figure, so that larger companies do not skew the result.
Leaderboards and industry analysis exclude sub-brands, regional entities, companies with fewer than 1,000 LinkedIn employees, and those with fewer than 12 months of data. All analysis was run in Python (pandas, numpy, scipy) on the full 860-company panel, with no sampling.
Full methodology is available in the companion technical report, The Employee Advocacy Multiplier, at tribalimpact.com.
The data and findings in this report are drawn from original proprietary research conducted by Tribal Impact. This research has not been previously published. © Tribal Impact 2026. All rights reserved.