.png?width=200&height=92&name=Tribal%20Logo%20Dark%20Grey%20(1).png)
What does a good employee posting rate look like? What share of a C-suite should be visible in an average month? Is a dip in your programme's numbers a problem, or is your whole sector quiet?
Questions like these have run on instinct for years, because the comparison data available was largely survey-based: programme managers reporting what their organisations say they do.
This page answers them with behavioural benchmarks, drawn from what people did rather than what programmes reported: the LinkedIn posting of 860 global B2B companies, measured every month for 40 months, layer by layer from the C-suite to the employee base. The figures come from The Human Edge Report, our 2026 research report and this article sets out the headline numbers and how to use them.
What is a good employee posting rate?
Across the 860 companies we track, between 6 and 7% of employees post on LinkedIn in an average month. That is the 2026 baseline, down from around 10% in early 2023.
The top of the table runs far ahead of it.
-
Commvault leads the dataset with 23.1% of all employees posting in an average month,
-
Cohesity at 22.5%
-
Monday.com at 21.8%
-
Nexthink at 21.2%
-
Dynatrace at 19.6%
-
Mishcon de Reya, at 19.5%, shows the standard is reachable outside technology: a legal firm sits sixth in a leaderboard otherwise dominated by IT.
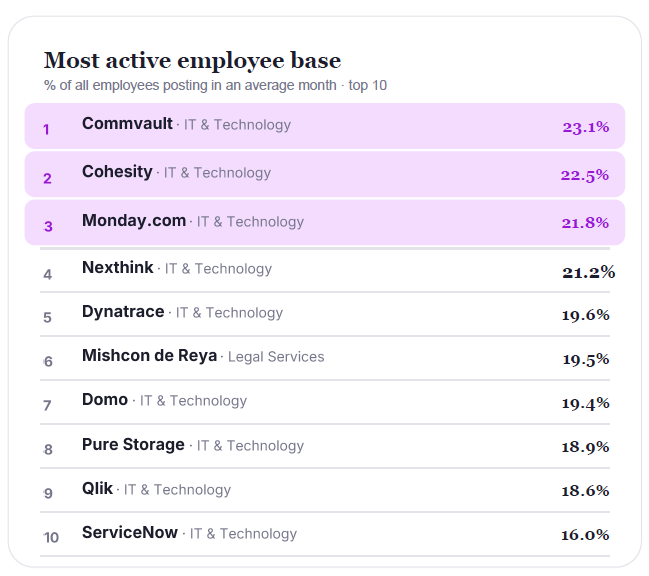
A useful rule of thumb from the data: a large organisation with more than 15% of employees posting monthly is operating at roughly twice the global baseline and inside the top tier of the dataset.
What is a good posting rate for executives?
On average, between 13 and 15% of CXO-level leaders post in a given month, down from 25% in early 2023. 70% of the companies we track have seen CXO activity fall since then.
The leading companies again sit far above the average.
-
At Commvault, 52.9% of C-level leaders post monthly.
-
Autodesk (51.4%),
-
iCIMS (51.3%), Ivanti (49.7%)
-
Extreme Networks (46.2%) complete the top five
The benchmark for a genuinely active executive layer is roughly half the C-suite visible every month.
Executive activity matters beyond its own reach. When leaders post more, employees follow; when leaders go quiet, employees go quiet too, usually within two months, a link that held in 82% of the companies we tracked.
Which layer matters most?
The VP and Director layer. Companies with the most active VP and Director layer see 4X the employee posting of those with the least active. The same comparison for the C-suite gives 2.6X. The management tier directly above sales teams, experts and employees is where behavioural norms are set, and in 80% of companies, this month's VP and Director activity predicts next month's employee activity.
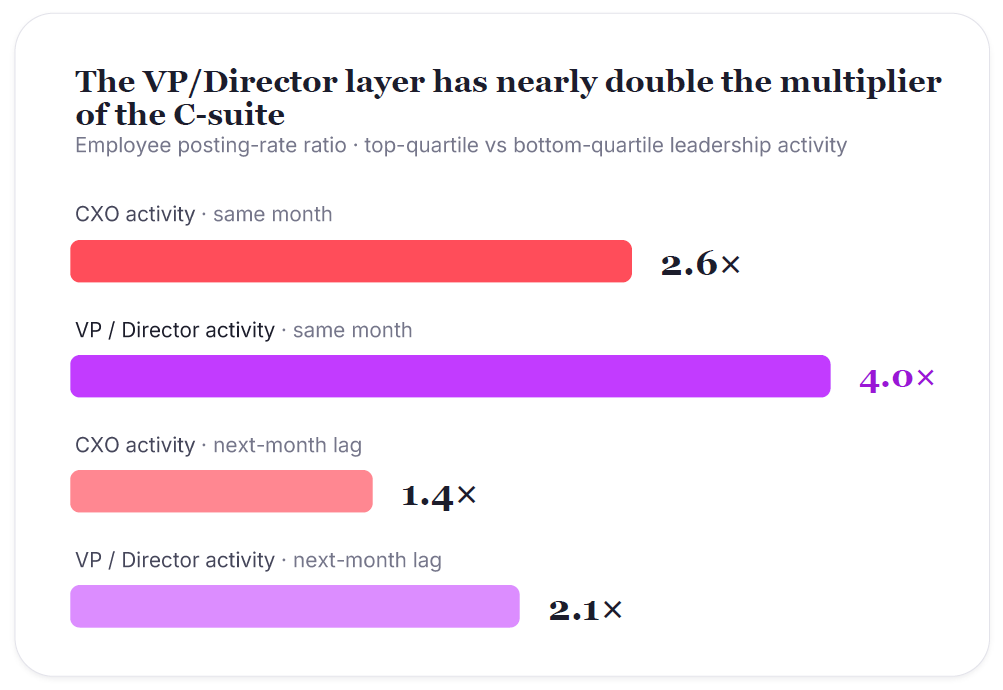
For benchmarking purposes this means one number deserves more attention than any other: the direction of travel in your middle layer. It moves one to two months ahead of everything below it.
Does the pattern hold across industries?
Yes, and this is what makes the benchmarks usable everywhere. The same sequence, leadership activity shaping employee activity, appears in every one of the 11 industries we track. Even in the weakest sector, the leadership-to-employee link is positive in 98% of companies. Manufacturing, financial services, legal, life sciences, energy, technology: the cascade is not a technology-sector story, and no industry we measured is exempt from it.
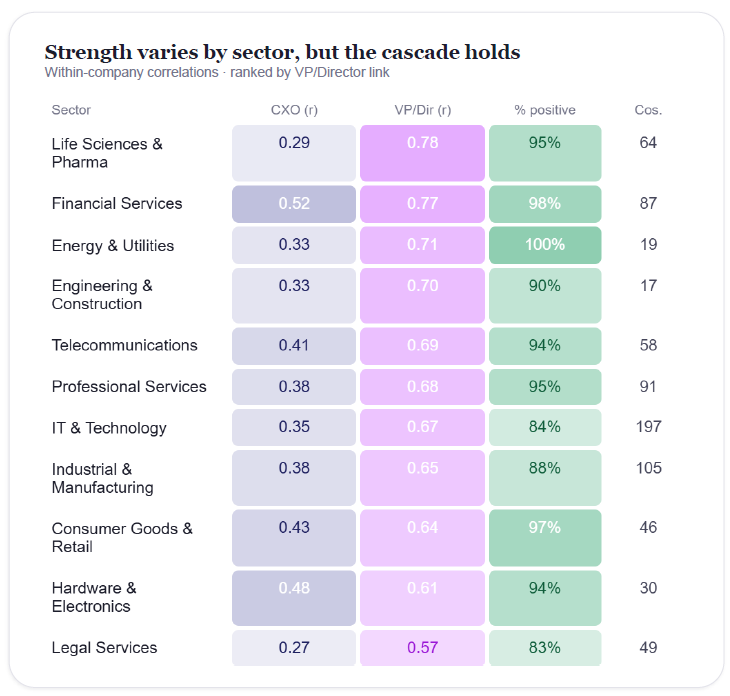
What varies by industry is the strength of the effect and the absolute level of activity, never the direction. The practical consequence: the pattern is universal, but the standard to hold yourself to is local, which is what the sector benchmarks are for.
How do the benchmarks vary by sector?
Considerably, which is why cross-industry averages mislead. Legal Services is the most active sector we track, with 11.3% of lawyers posting monthly, yet it shows the weakest leadership-to-employee link of all 11 industries. IT and Technology, with 197 companies the largest sector in the panel, dominates the activity leader boards while ranking in the weaker half for connectedness.
The benchmark for a law firm is other law firms, and the benchmark for a software company is the other 196 in the panel. Our sector report series, beginning with IT and Technology in September, publishes these benchmarks industry by industry.
Is consistency or volume the better benchmark?
Consistency. The most consistent companies in the dataset post 25% more than the least consistent, with three times less month-to-month variation, and in 8 of the 10 most consistent organisations, that steadiness holds at every layer, top to bottom. The consistency leader-board is telling: Iron Mountain, New York Life, Baker McKenzie, Teva Pharmaceuticals and Parsons Corporation lead it, and none of the five are technology companies.
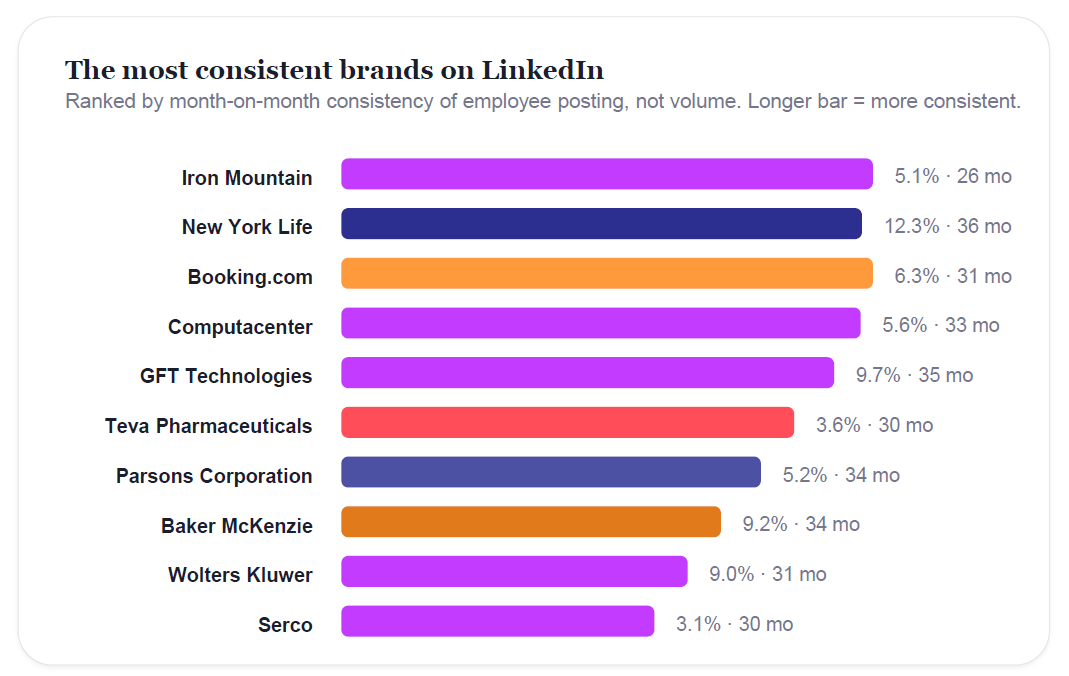
A programme whose activity spikes around launches and fades in between will not close the gap on these organisations, whatever its peak months look like. Steadiness is the benchmark that predicts durability.
How to use these benchmarks
Three comparisons tell you most of what you need to know.
-
Your employee posting rate against your sector, not the global average.
-
Your VP and Director layer against its own recent trend, since it leads the system.
-
Your month-to-month variation against your volume, because a steady middle performer outlasts a spiky high one.
We can run the full comparison for you: your leadership, sales and employee activity benchmarked against the 860-company dataset, by industry, seniority and function, with the gaps identified and what closing them is worth.
Contact us at hello@tribalimpact.com, or read the full research first: https://www.tribalimpact.com/thehumanedgereport
About the data
The benchmarks in this article come from The Human Edge, Tribal Impact's original research covering 860 global B2B companies across 11 industries, measured monthly from March 2023 to June 2026. Leaderboards exclude sub-brands, regional entities and companies with fewer than 1,000 LinkedIn employees or fewer than 12 months of data. Full methodology is published in the report.